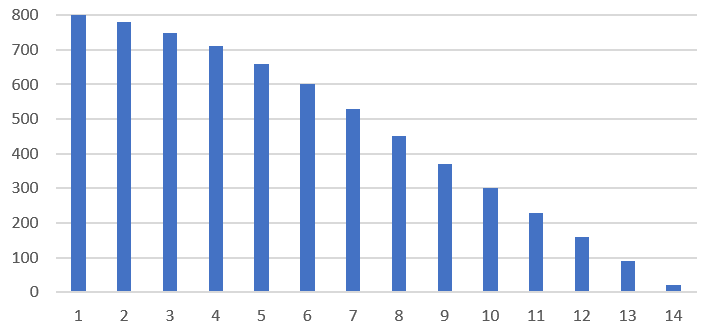
Imagine that you know that 6450 in your country were tested positive the last fortnight. Imaging these 6450 incidences were distributed as in one of the following images. There are alternative ways to describe the situation.
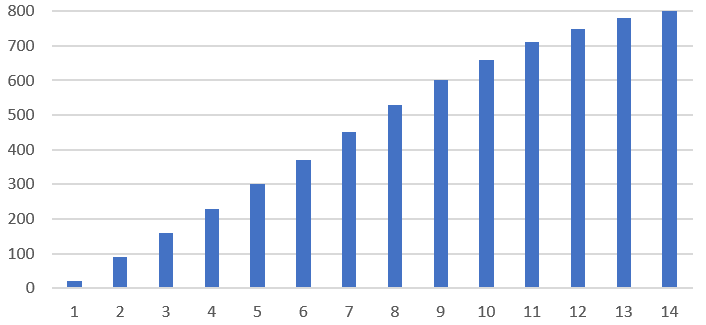
- One way would be to say that you have a rolling window of 6450 incidences per fortnight, on average 461 per day. This would give the same 461 average daily incidences for either of the cases regardless of growing incidences or decreasing incidences.
- Alternative, you could focus on the last 7-days. You could then conclude that the latest rolling 7-day daily average “I” is 690 for the first case and 231 for the second case.
- A third way would be to describe the cases with their current reproduction number “R”. “R” gives the average number of new infections each infected person cause. “R” for the first case is 1.5, and for the second case, “R” is 0,5.
The problem
Each of the three above alternatives has its advantage and disadvantage.
- Gives a stable number and is often the preferred view by authorities. However, to a large extent, it describes a historical situation with no clue about whether things have improved or degraded.
- Gives a fresher view. We now also get clues that the first case was worse than the second. However, it is still a historical view.
- Gives insights that the first case is getting more severe and the second case decreases in severity. However, the R-value doesn’t give any insight into how serious the situation is. If the number of cases is low, it will take a long time before it becomes serious, even with a relatively high R. On the other hand, with many new cases, even a low R may not indicate that the situation is safe.
A better way
There is a fourth way to describe the situation: to combine the insights of “I” and “R”. If you multiply I with R, you will get a measure of how many WILL be infected. We get insights into the future “I”. More precisely, we gain insights into the number of positive tests five days ahead, this as five days is the SARS-COV2 reproduction cycle. We call the product of multiplying “I” with “R” the S-index™. The S-index™ is a severity index that we normalize to 1 for 35,7 daily incidence and a stable situation with “R” =1. 35,7 daily incidences corresponds to ECDC level of 500 cases for a fortnight which is seen as an extremely high level of infections.
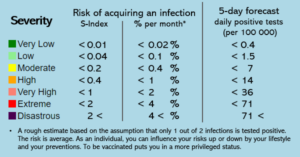
In the cases above the S-index™ for the first case is 2, and for the second case, the S-index™ is 0.2. We now thanks to the S-index™ know that case two is of moderate severity while case one is a very serious extreme situation. S-index™ gives us more insights into the situation than ”I” and ”R”. We get a predictive view of the severity of the situation from the risk of getting infected perspective.
Further information
- We use our own formula to calculate R.
- We only present the number of cases relative to the population. The media has often presented absolute numbers during the pandemic, which never assesses how serious the situation is in a country or a state.
- More information about our data sources